Accelo Sales Module
Founding the research practice behind Accelo's first redesign
Founding the research practice behind Accelo's first redesign
Accelo hired three designers to form its first-ever UX team and overhaul a B2B product of 12-plus modules, starting with the Sales Module as the pilot. I was the only one of us with a research background, in an org where leadership was used to deciding from its own experience. So before I designed anything, I built the thing the redesign needed and didn't have, a working research practice. My team wouldn't understand the value until late in the process when the redesigned UI tested well the whole way through and then failed in the closed beta on a problem only real-world use surfaced.
My role: I owned and ran all of the user research and the interaction design, and I led the hi-fi prototyping for usability testing. Two colleagues led the visual design and the design-system build. I built components in Figma to fill gaps in my own designs and reviewed every control before it shipped, but the Figma-to-code handoff was theirs. For my scope the system worked more like a component library than a full design system.
Accelo is B2B SaaS that manages time and money across an organization, spread over more than a dozen modules. The mandate was to overhaul the UX and UI of the whole product and stand up a design system, with the Sales Module as the pilot everything else would inherit. The primary constraint was to refine existing features rather than add new ones.
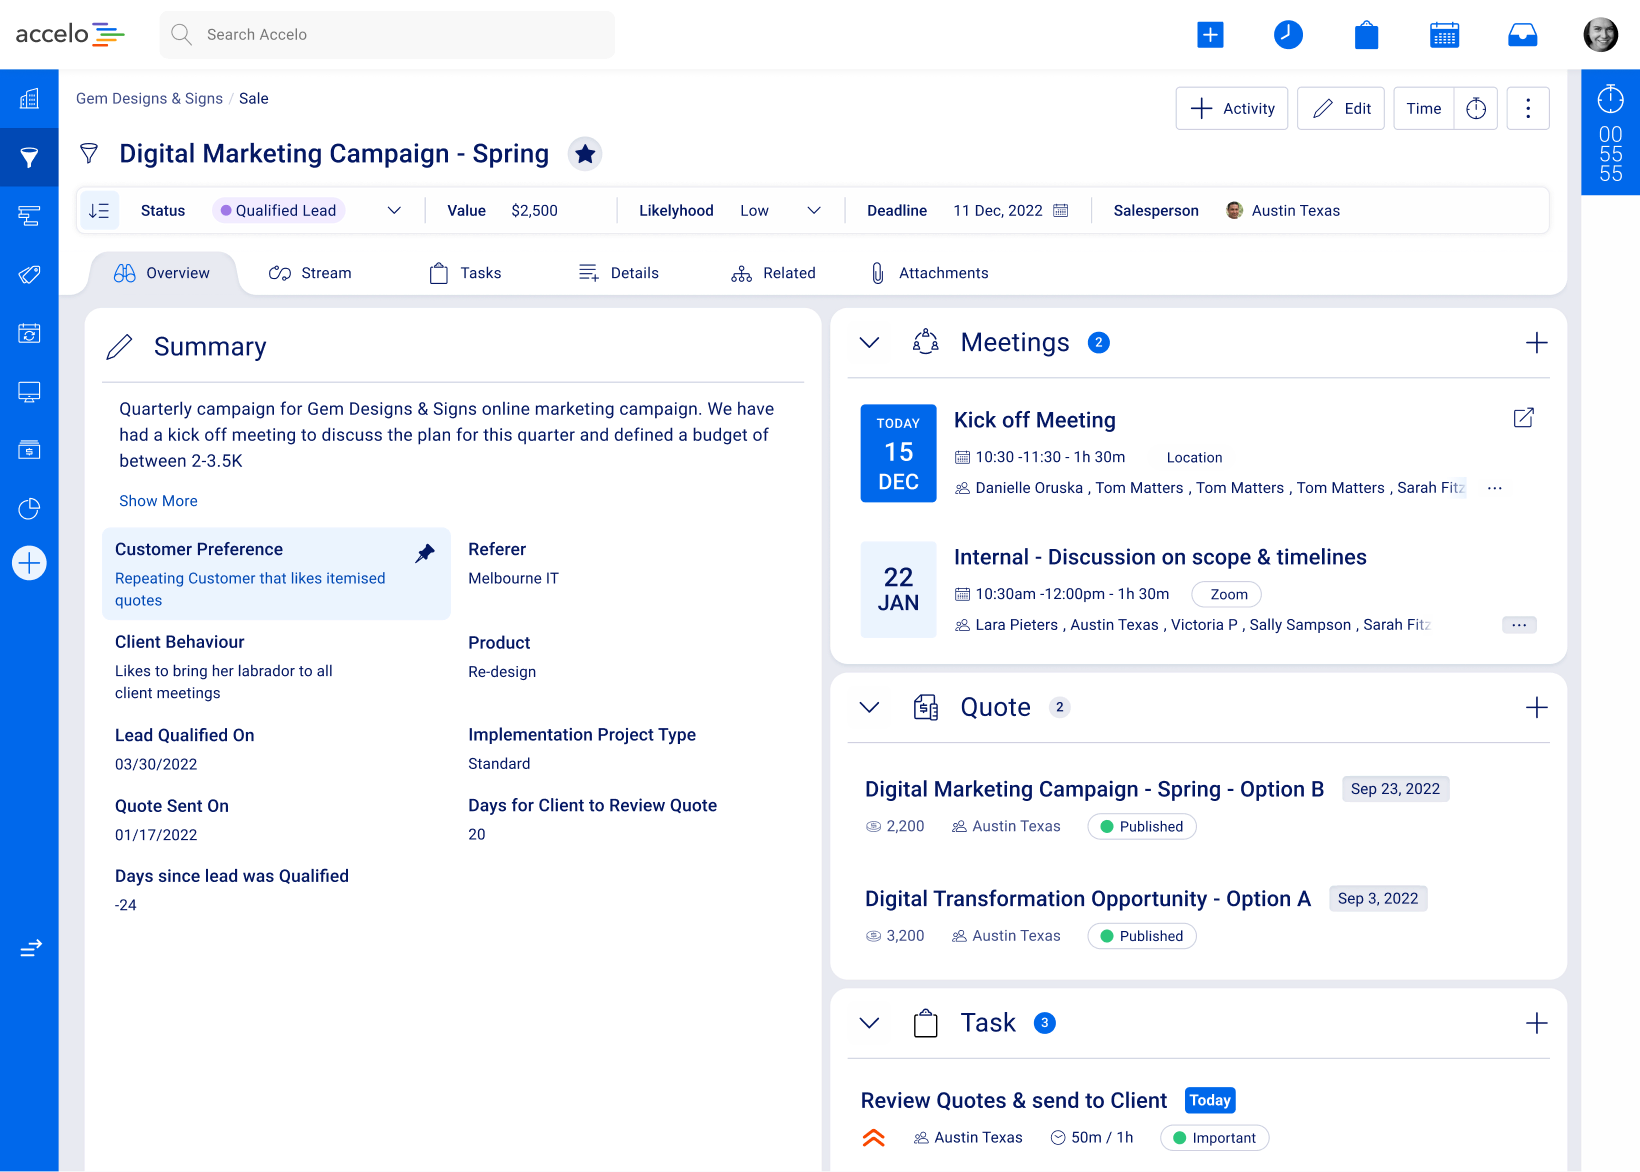
I was the only specialized UX professional in the company. My two teammates were talented UI and graphic designers, but neither came from research. Leadership was used to directing features from its own experience, and the slower practical steps UX depends on, like interviews and validation, weren't yet part of how decisions got made.
That set the real problem underneath the pilot. I couldn't do research-driven design in an org that didn't yet value research. The design work depended on evidence no one was collecting, so the first job was to build the practice that would produce it.
I established Accelo's first UX research process on my own, so it was lean.
I started with a feature inventory of the existing product and kept it current throughout. From there I ran discovery interviews that fed personas and empathy maps I shared with product and leadership. I pulled real click-rate data on how users moved through the legacy app, ran asynchronous card sorting to understand how people expected features to be grouped, and used focus groups to validate wireframes before they went further.
A large part of the job was sanity-checking the solutions product and the POs proposed, and flagging where their assumptions were at odds with what the research showed. I did this without dev input at that stage, as the goal was to settle the direction before it cost engineering time.
Even the plumbing was mine. I established interview invitations templates, templates for presenting findings so the practice stayed consistent, and recruited users to talk to.
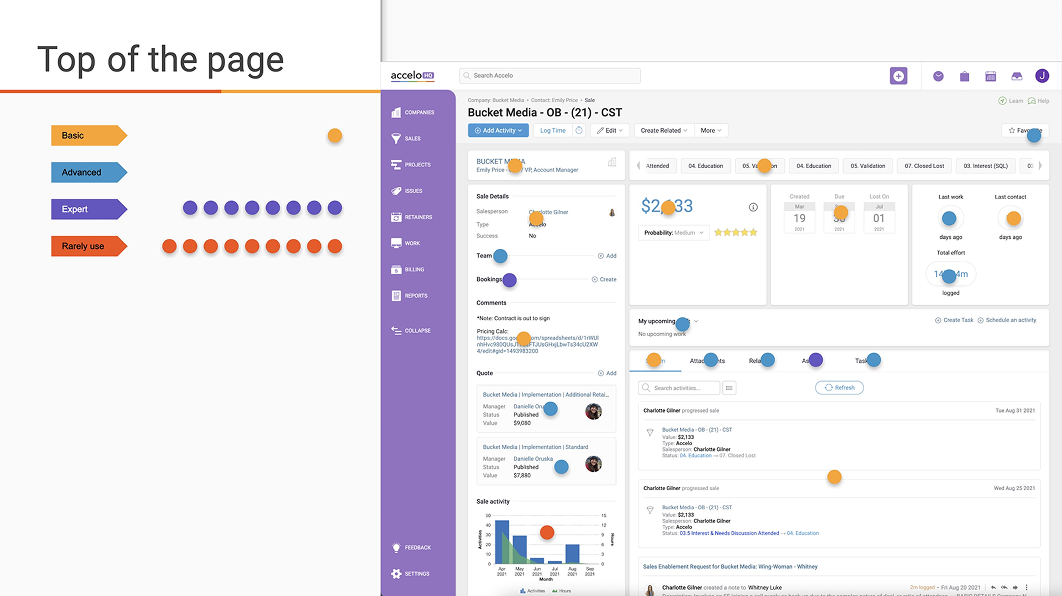
As a budding researcher I struggled to juggle it all, and it took about a year to get real traction. My teammates came around first and improved their own workflows. Leadership was the harder sell, so I brought the practice to more people. I ran design thinking workshops with developers, product, sales and the UX team, and trained non-UX staff to run their own user interviews, so the evidence didn't depend on me alone. The payoff was that the value of research started to permeate the org. Leadership eventually put two new team members on interview and research duty, which gave me room to focus on other aspects of the research and design.
Early designs had to do two things at once. It had to refine one module and establish the patterns the entire future redesign of the other modules would inherit. Designing for modules I couldn't yet audit in depth was the hardest part.
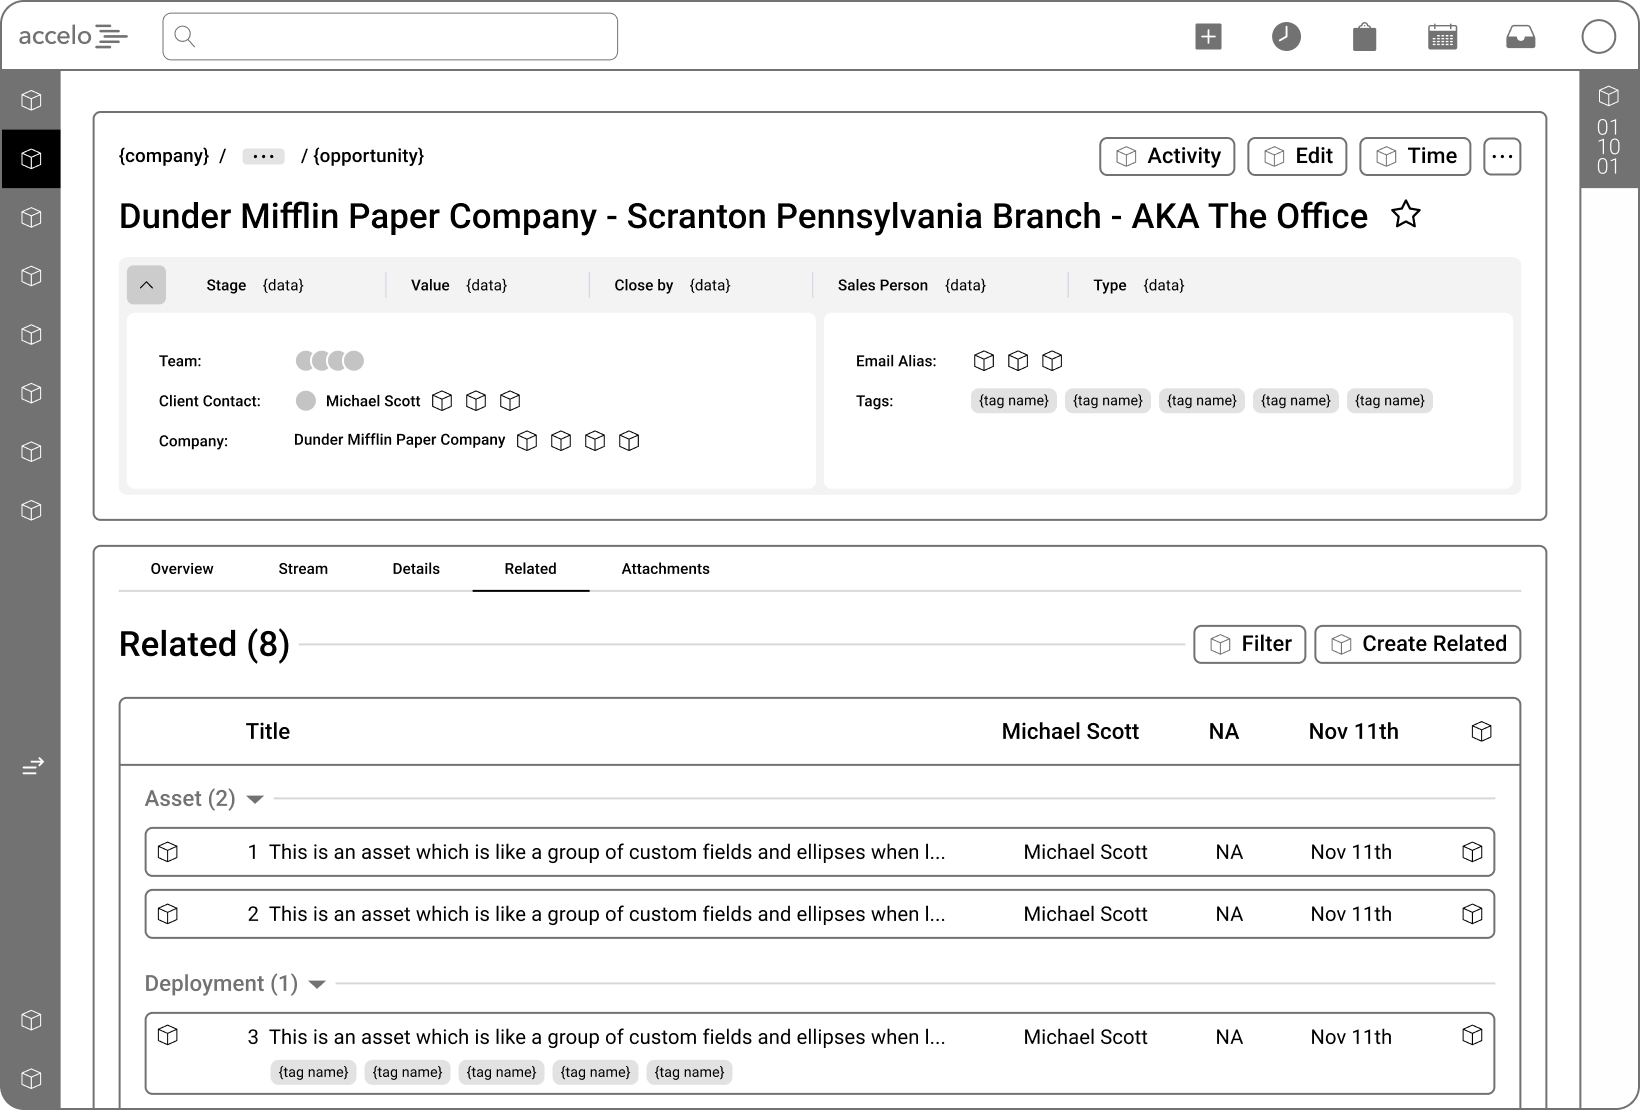
The answer was a two-part framework. An "Anchor" sits at the top of every module, carrying the common controls and the highest-priority data, with an expandable Info Bar for detail on demand. Below it is a Tabs section, where the day-to-day work happens. The split gave every future module a predictable backbone while leaving room for what each one specifically needed.
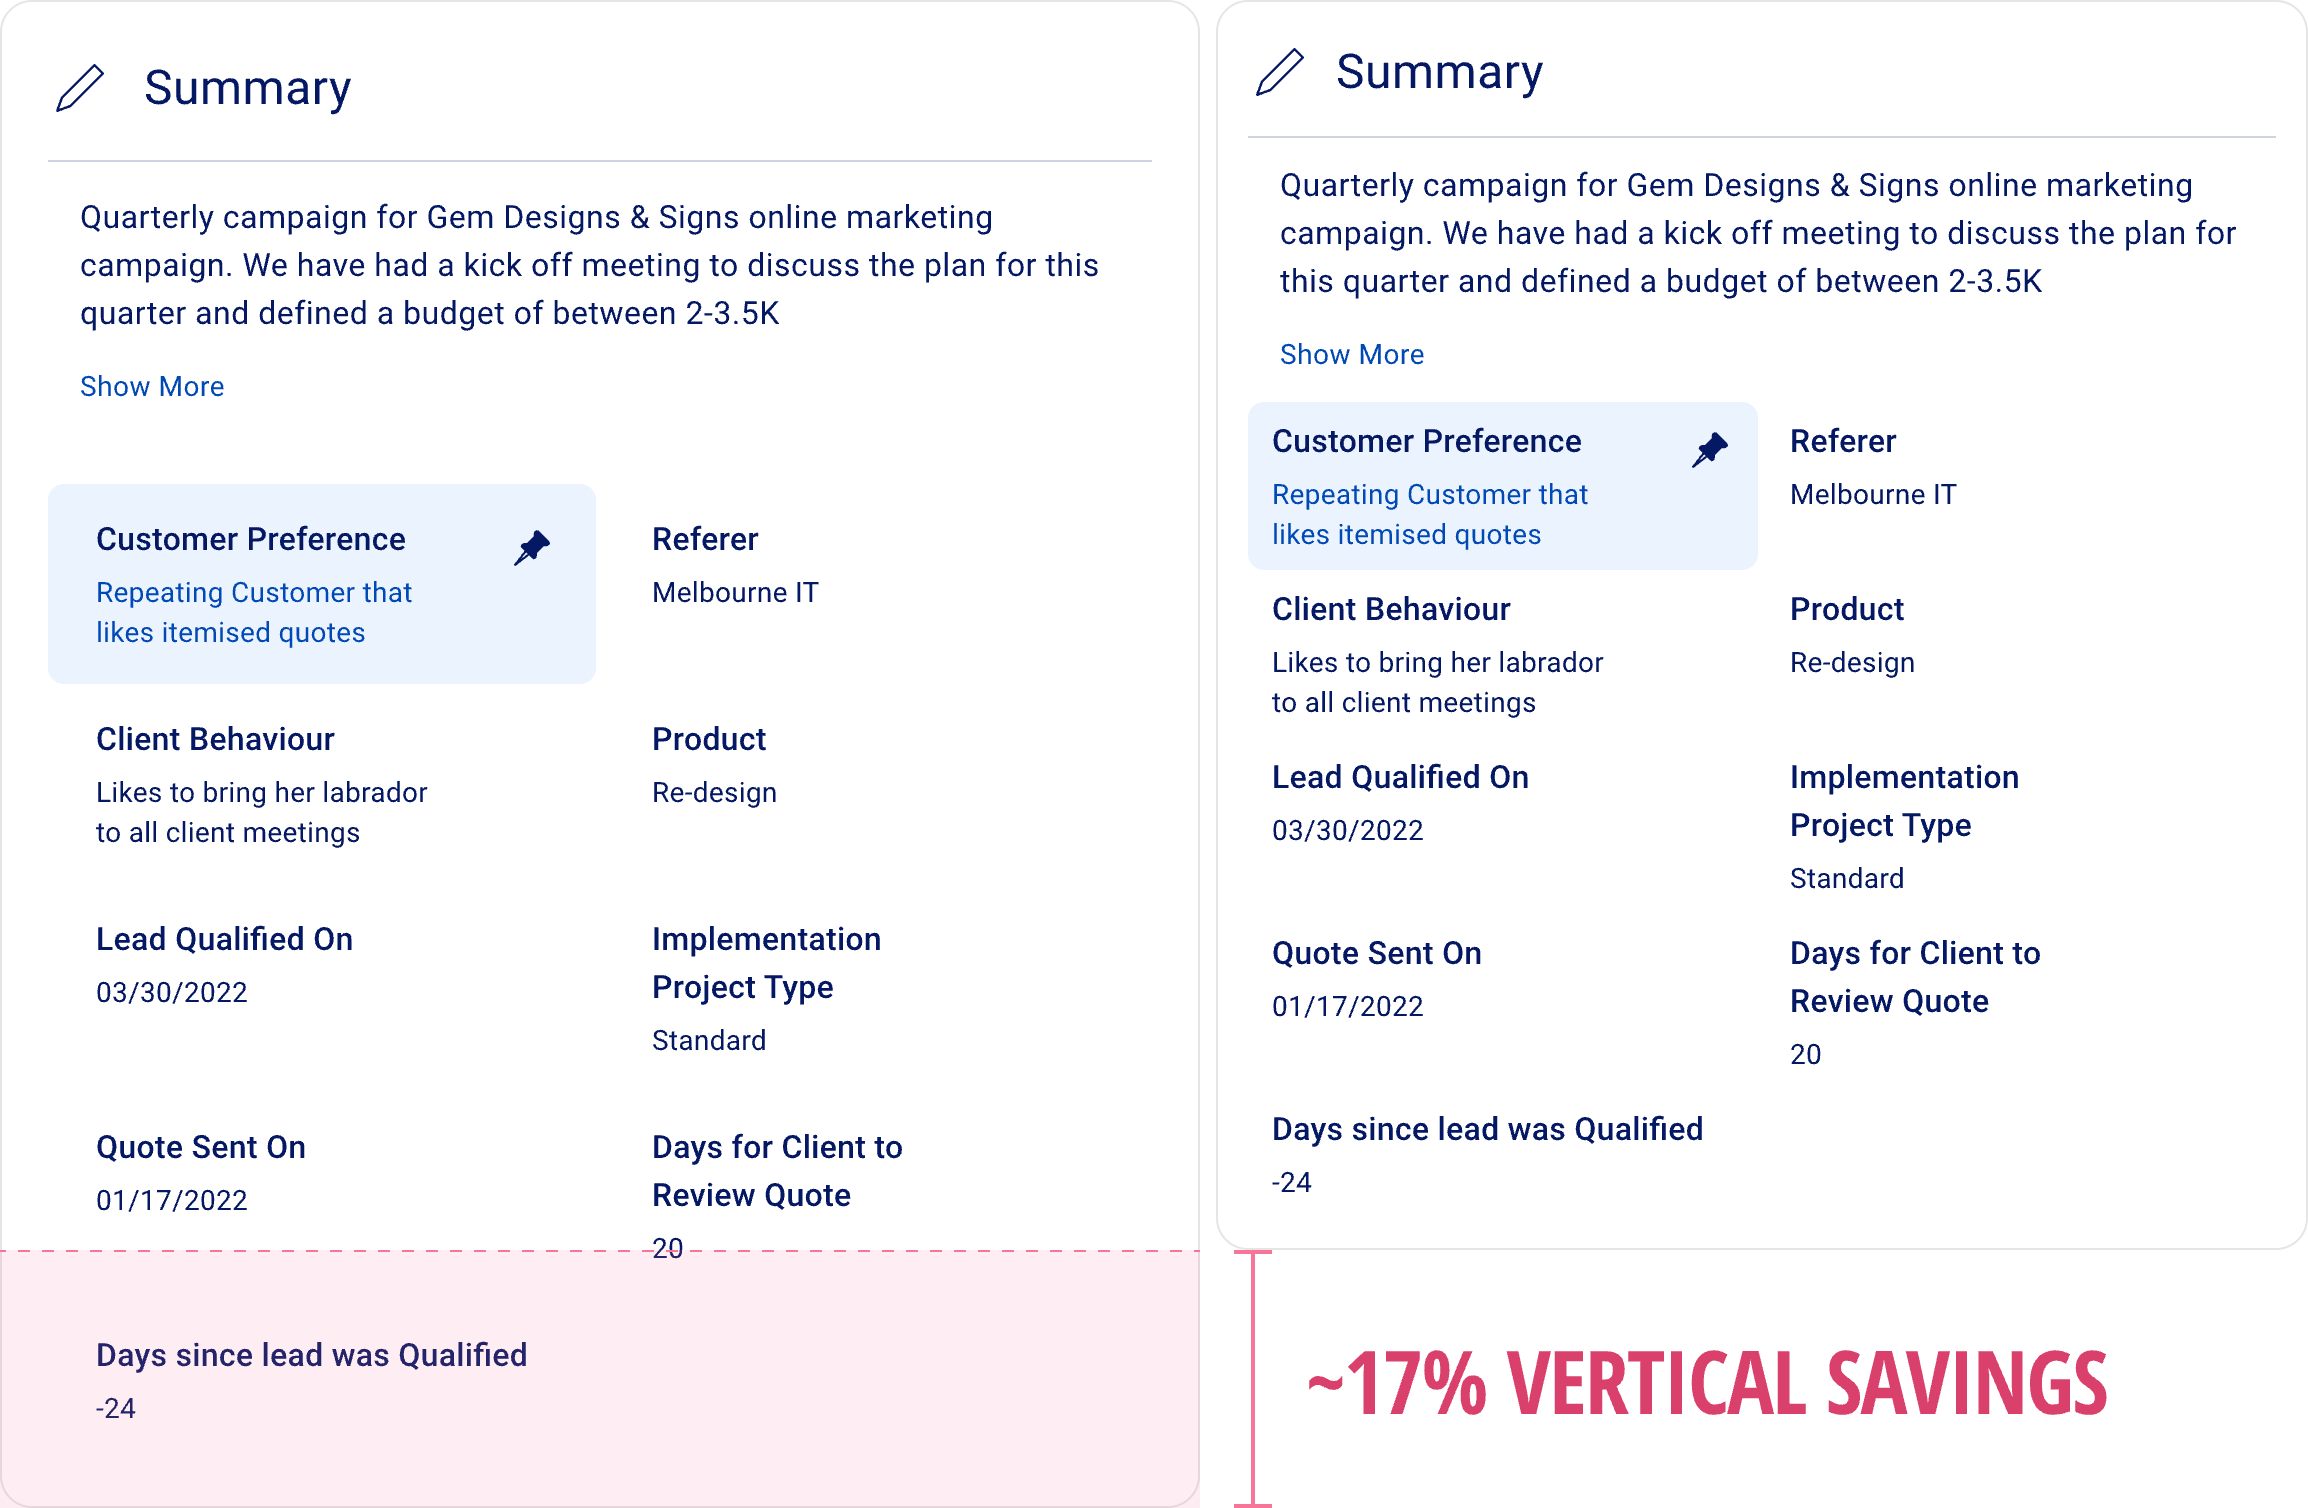
The team's visual direction was a clinical, low-color UI meant to reduce cognitive load. It tested well throughout the usability sessions. Then it failed in the closed beta. In real daily use the data density was too low, so people scrolled and searched more than they should have, and the information hierarchy was too weak to lean on. The prototypes had caught a lot, but this was the kind of problem that only becomes apparent in real world, varied workflows.
That's the call I'd defend from this project. The clinical UI passed every usability session, so the density and hierarchy failure only surfaced once real work ran through the beta, and catching it there was the harder half. The fix was a systems call. I routed the correction through the design system's tokens rather than one-off screen edits, so it propagated to every module set to inherit the pilot instead of being reworked layout by layout. The token and code execution sat with the team, but the diagnosis and the route to the fix were mine.
Prototypes catch a lot, and they missed the thing that mattered most. The clinical UI passed every usability session and still failed on density once real work ran through it. What saved the project was validating in a closed beta before a wide release, which turned an expensive downstream mess into a fix I could route through tokens. I trust prototype testing less on its own now, and I build in a real-world validation step before anything ships broadly.
Involving product and leadership throughout the research also paid off in a quieter way. Handoffs were smooth and few decisions got re-litigated, because the people who could have objected had already seen the evidence.
The deeper lesson was about building the first design system under real constraints. It taught me to ask the scalable, real-world questions up front, about density, accessibility, and how a pattern holds across modules I can't see yet. Those questions are cheap when you plan for them and expensive to retrofit, both for the team and for users already settled into their tools. That habit is the seed of the future-proofing approach I use now.
I moved my design practice onto Claude Code and off Figma, then built the design system and research systems that made it reliable enough to trust. The speed came without giving up the decisions.
Read the approach