Case contacts
Designing less: making the contact experience legible
Designing less: making the contact experience legible
About 61% of active accounts adopted the new case-level Contacts tab in its first year, measured by its core action, adding a contact to a case without forcing a role. The cards that replaced the contact record's data tables are in production too. In a product where the go-to pattern is to add columns, I designed the contact experience in the other direction, showing less on purpose so the people working a case can read it at a glance. The work spanned two surfaces, a new case-level Contacts tab and a redesign of the contact record's data tables.
My role: I owned all of the design across two release cycles. Product management led discovery and research. I analyzed that research, set the design scope with PM, and made the design decisions.
The product, a cloud case-management system for law firms, was built from three older tools, all three with a change-averse user base. The result is dense, inconsistent tables and screens that grew bloated and messy. Two problems sat in the contact experience, and I tackled both across two releases.
First, a single case could involve dozens of contacts, split across separate tabs by type: parties, counsel, providers, and so on. There wasn't a functional way to see everyone on a case in one place. The one list that existed was hard to find, listed a contact once per role causing duplicates in the list, and showed little more than a name and a phone number which missed other core information for case managers.
Second, the contact record's own page, which displayed data tables for addresses, phone numbers, and emails were all cramped and scrolled sideways leaving key table controls out of sight.
The legacy solution for both was the same: more columns, bigger menus, more on the screen. In an attempt to set new, future proof standards, I argued for restraint and minor deviations in the design patterns, and most of my work was championing the risk to do so.
I designed a single Contacts tab, available inside cases and intakes, that lists every contact on the matter. Firms can turn it on or off, and it defaults on for new firms to meet what is a fundamental expectation for case-management software competitors. Those change resistant law firms, should they not find the new tab useful, can still opt to hide it with a simple setting update.
What users asked for most was a way to add a contact to a case without forcing a specialty role, and the challenge was a data architecture gap, not a simple UI update. In the case-management product a contact never existed without a role, and that role was set by which tab you added them through. To show everyone in one list I introduced "Involvement" as the field that unifies the disparate roles, letting one column carry a party, a counsel, or a provider.
I took the opportunity to enable adding contacts without a role as plenty of real contacts don't fit a type, like the guardian of a minor, or an investigator who was considered but never used, and the new tab lets you add them as plain involvements. About 61% of active accounts used this in the first year.
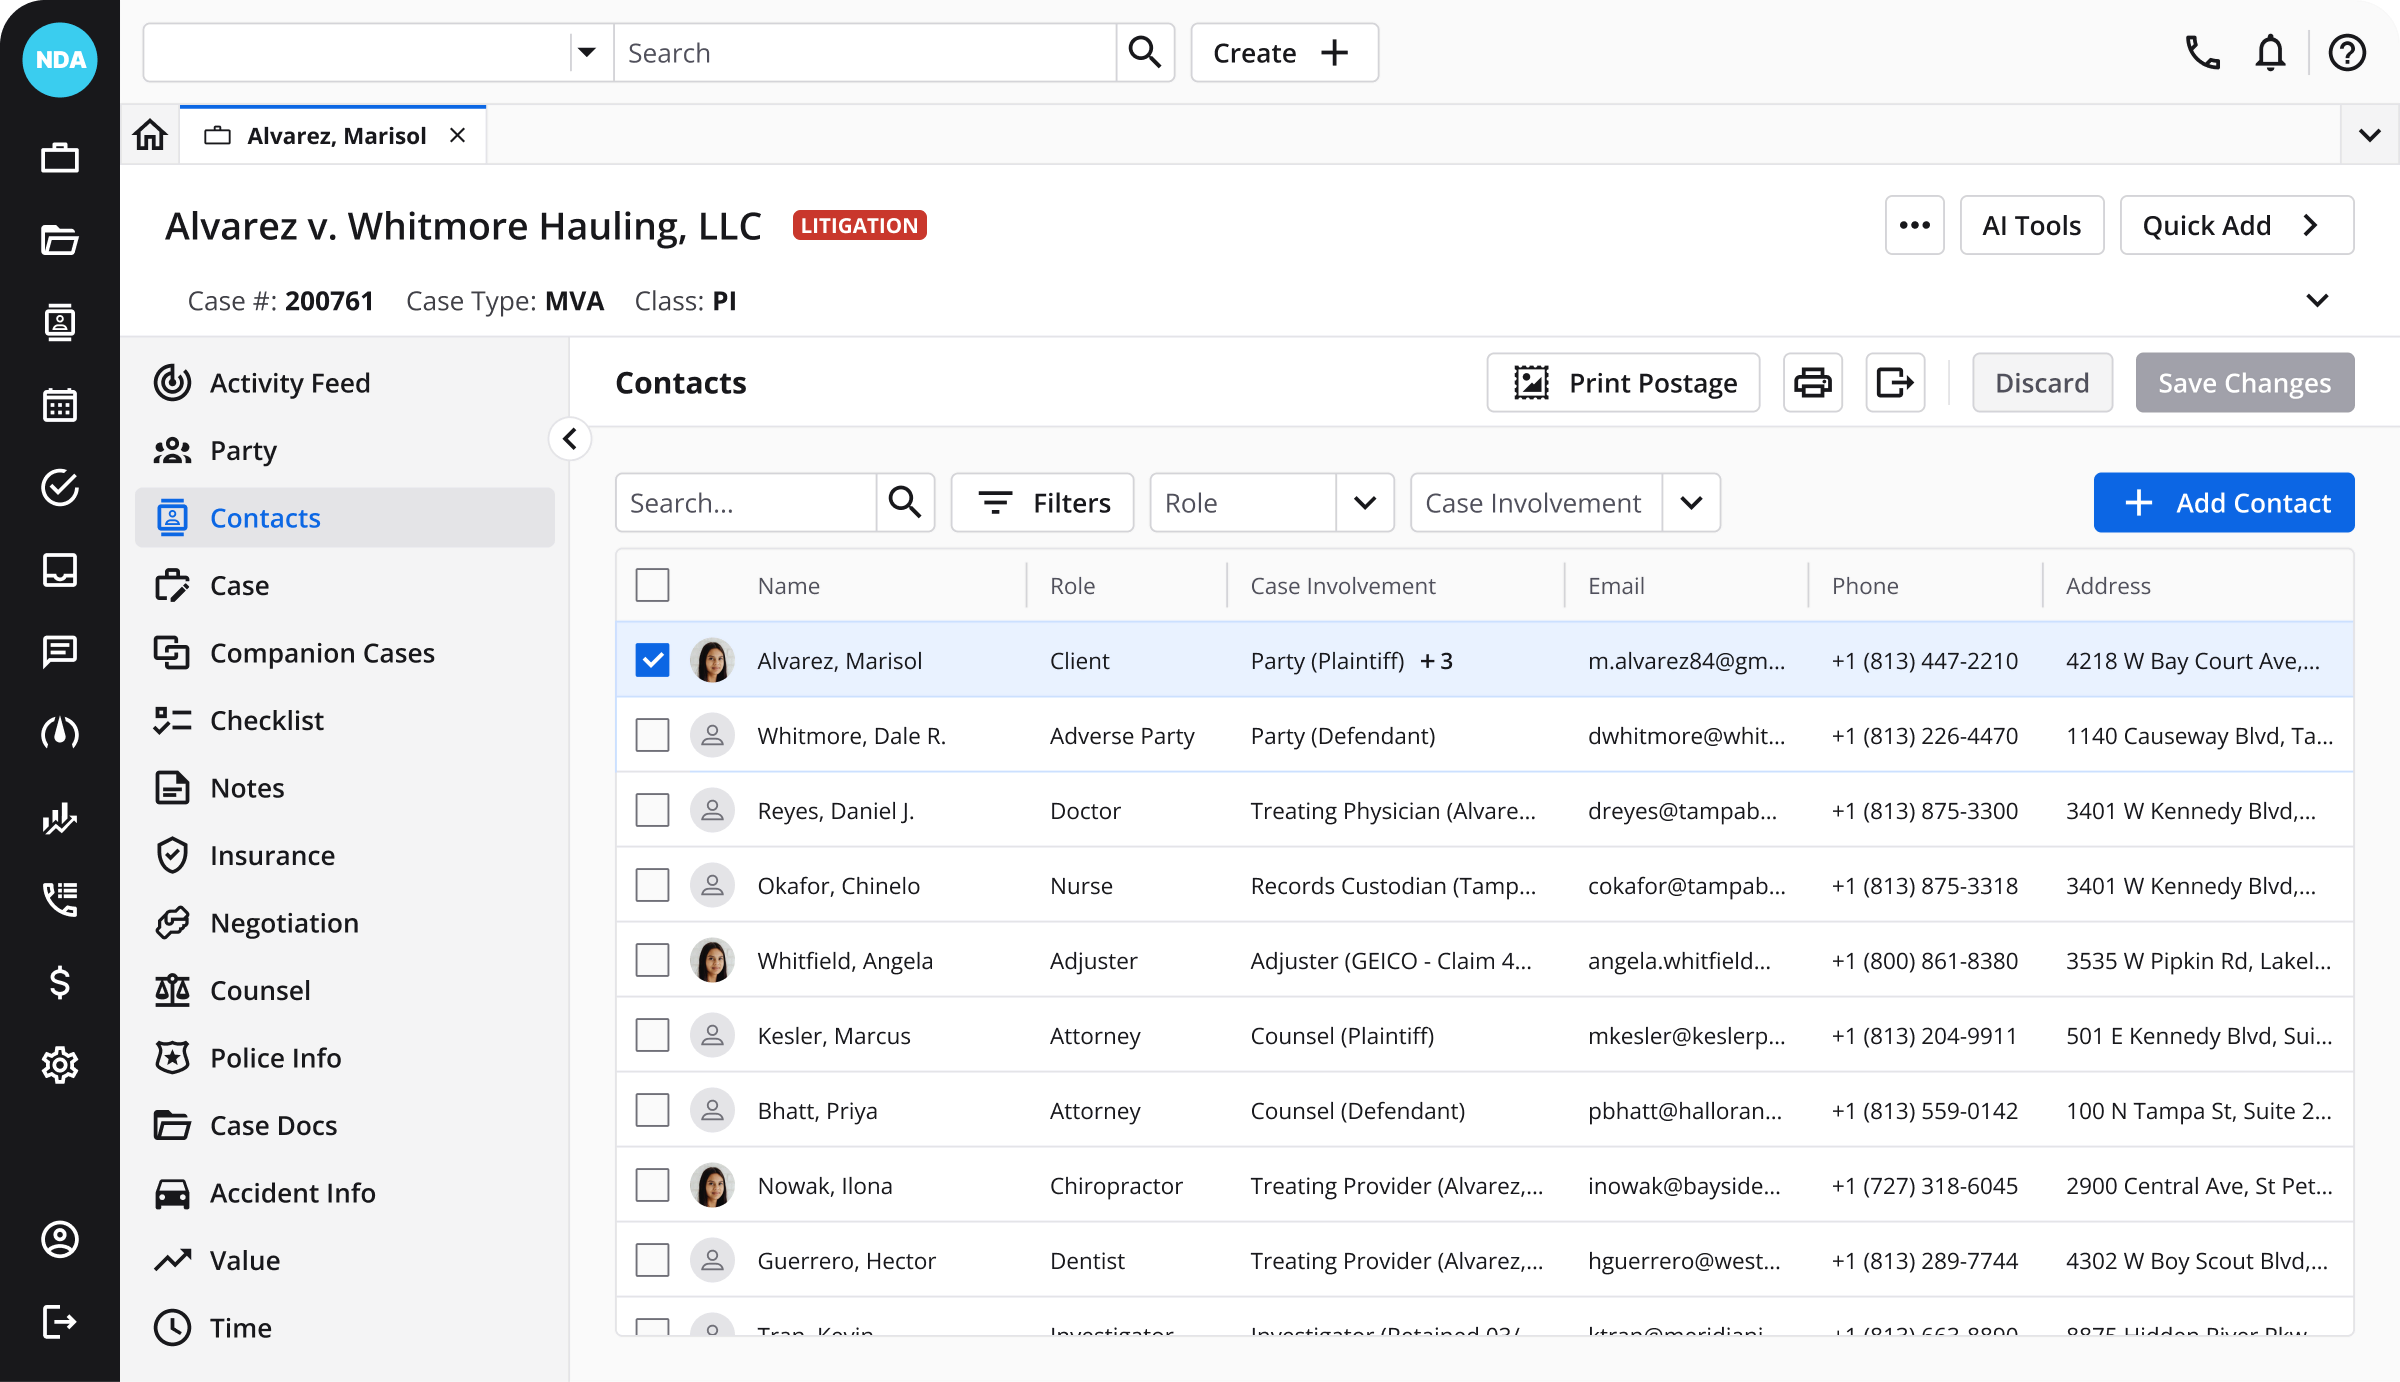
Contacts carry several addresses, phones, and emails, and a single address alone can fill the width of the screen so I purposely trimmed it against the default design patterns. I capped the columns to what someone needs at a glance, pushed full detail into a side panel, and ordered the roles by importance so the top roles are shown over the rest. The product also had a history of inconsistent design patterns, so I took this new tab as an opportunity to review and validate as many as were functional for this project to minimize change and set future standards.
There were a few places I had to compromise though. Contacts with multiple roles and involvements clash with the limited space of a table column. I had designed a solution with an overflow pattern via an on-hover popper to show the remaining roles for a contact, however this was cut so users ultimately needed to open the contact to see all roles. In practice that hasn't hindered adoption as teams working a case tend to know their contacts well and access to the data isn't out of grasp, just a little less on hand.
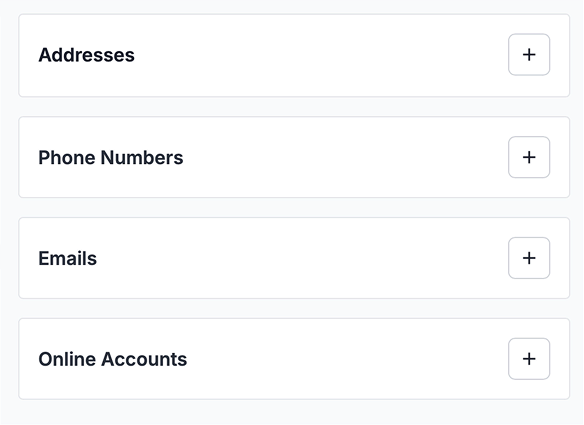
The second release started as a request to fix the contact page layout. There was a column of editable fields, and another composed of multiple tables for different contact data. The tables were too tall when empty, too cramped when housing data, and their row controls sat off-screen until you scrolled sideways.
I spent the first stretch exploring a cheap fix, rearranging the page without touching the tables. The real value of that exercise was proving to the team that layout wasn't the problem, it was the tables. Once I could show that, I made the case for the larger change that would actually solve the problem and my team backed it.
My solution was to replace each table with a list of cards. Cards drop empty fields, size to their content, and keep the controls in reach, which removes the horizontal scrolling and reclaims vertical space when empty. And while I was designing these cards, I added a modular solution for a common user critique. A contact can hold three of any data point today, so if we ever get around to lifting that limit, a "view more" button opens a full-screen view with a table, which finally has the room to read and handle double digit data points.
Legacy tables
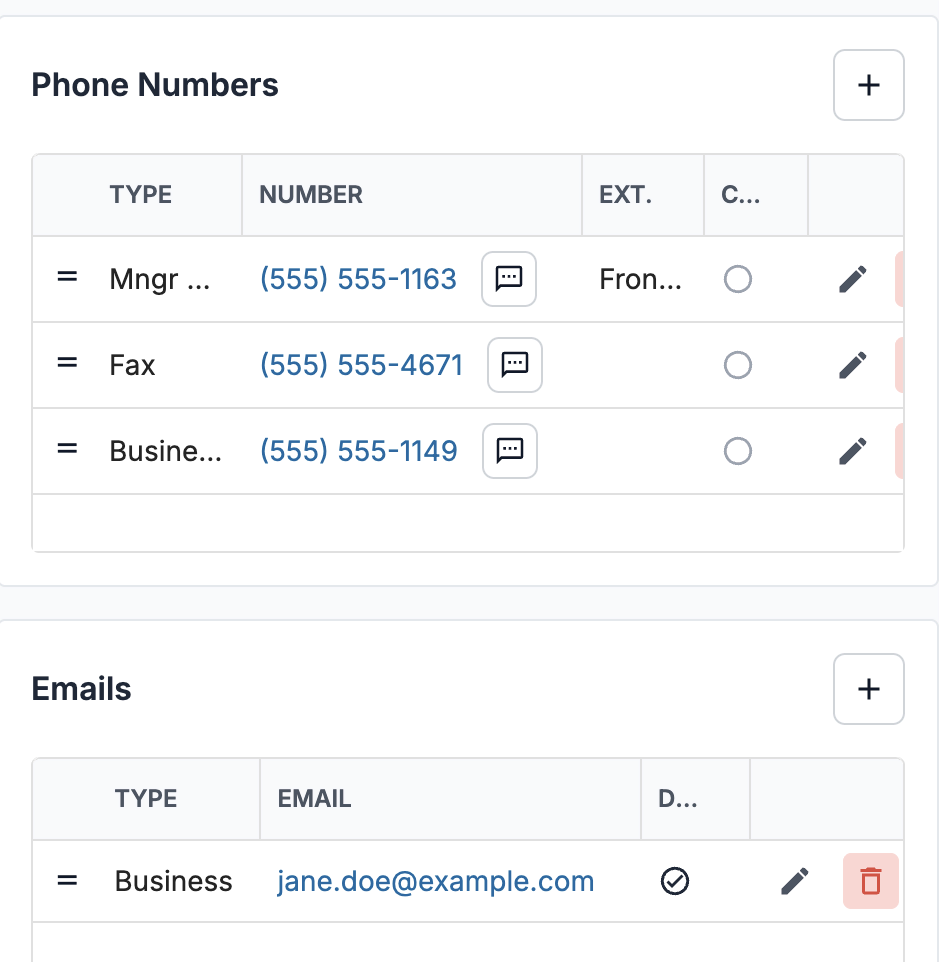
Cards
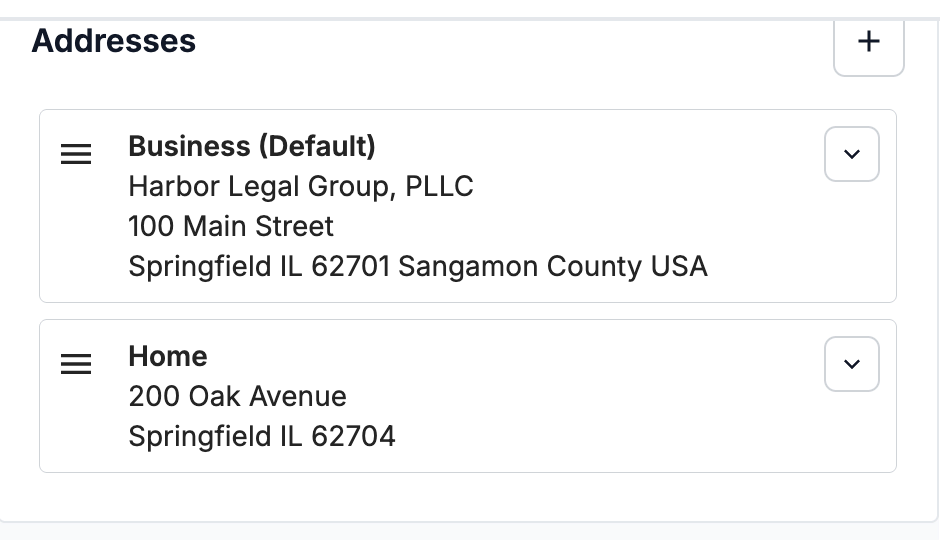
The cards only read as cleanly as the page around them. The product had historically separated sections with lines or loose whitespace, which wasted space and was hard to scan. Not long before this project, I had worked with my team on addressing a similar page issue where users were finding sections of editable fields difficult to scan, which we resolved by moving the page to a grey background and gave each section its own white box, containing the data and giving a bolder structure to read. I implemented the same pattern here where each table and section got its own white box to sit on a light grey background.
Original
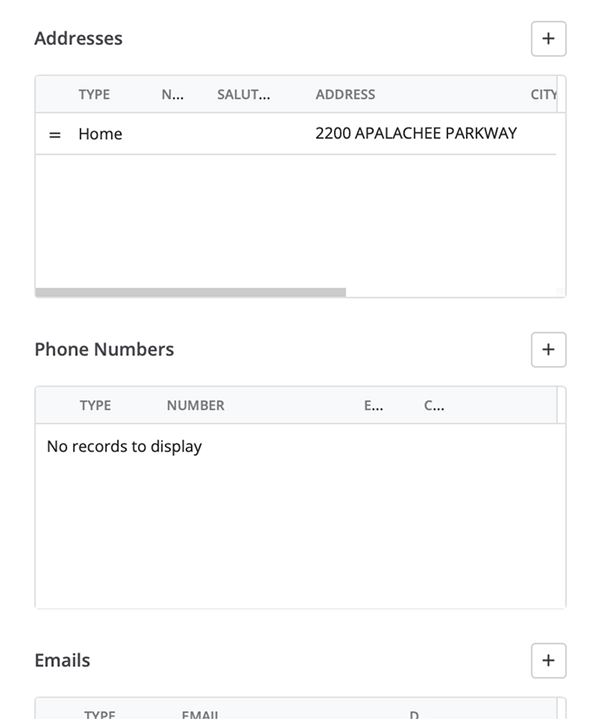
New, empty
New, populated
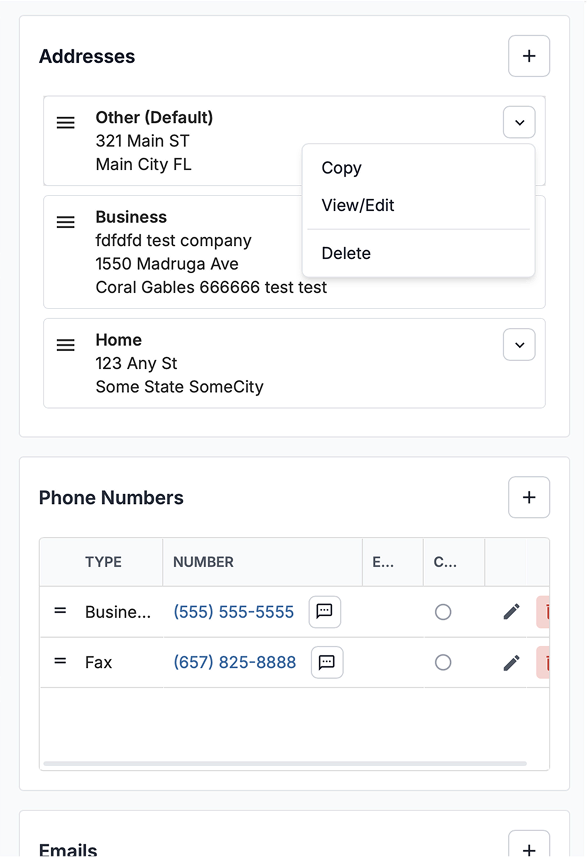
We shipped the cards for addresses, the worst offender, and left the other data tables for later. The page is still part old and part new, but the pattern is proven and ready to extend when there are dev resources.
Share of active accounts using New Contact on the Contacts tab, weekly, Jul 2025 to May 2026
| Week of | Share of accounts |
|---|---|
| Jul 20, 2025 | 16.5% |
| Jul 27, 2025 | 16.8% |
| Aug 3, 2025 | 18.4% |
| Aug 10, 2025 | 17.7% |
| Aug 17, 2025 | 19.5% |
| Aug 24, 2025 | 20.4% |
| Aug 31, 2025 | 17% |
| Sep 7, 2025 | 19.4% |
| Sep 14, 2025 | 19.8% |
| Sep 21, 2025 | 20.4% |
| Sep 28, 2025 | 20% |
| Oct 5, 2025 | 20.5% |
| Oct 12, 2025 | 21% |
| Oct 19, 2025 | 22.2% |
| Oct 26, 2025 | 18.6% |
| Nov 2, 2025 | 20.4% |
| Nov 9, 2025 | 20.9% |
| Nov 16, 2025 | 23.7% |
| Nov 23, 2025 | 16.7% |
| Nov 30, 2025 | 24.2% |
| Dec 7, 2025 | 23.1% |
| Dec 14, 2025 | 22.5% |
| Dec 21, 2025 | 14.1% |
| Dec 28, 2025 | 17.5% |
| Jan 4, 2026 | 25.5% |
| Jan 11, 2026 | 24.5% |
| Jan 18, 2026 | 25.1% |
| Jan 25, 2026 | 25.8% |
| Feb 1, 2026 | 26.6% |
| Feb 8, 2026 | 26.5% |
| Feb 15, 2026 | 24.2% |
| Feb 22, 2026 | 25.9% |
| Mar 1, 2026 | 26.2% |
| Mar 8, 2026 | 26.7% |
| Mar 15, 2026 | 26.4% |
| Mar 22, 2026 | 25.3% |
| Mar 29, 2026 | 23.7% |
| Apr 5, 2026 | 25.5% |
| Apr 12, 2026 | 25.4% |
| Apr 19, 2026 | 25.2% |
| Apr 26, 2026 | 26.5% |
| May 3, 2026 | 24.5% |
| May 10, 2026 | 27% |
| May 17, 2026 | 26.8% |
I'd build the Contacts tab the same way again. What users kept asking for was a way to see everyone on a case and to add the people who don't fit a type, and giving them that in a familiar format of a single tab mattered more than enforcing old patterns for the sake of tradition. I'd have liked to run more research, but the scope and timeline didn't allow for it, and the approach held up in follow-up conversations.
The table work was a little different. I spent probably 50% too long on proving the layout of the original contact screen wasn't the issue. It felt obvious but I wanted to do my due diligence before investing time in other concepts. Most of what was needed and what to improve on was founded in heuristic analysis, so I should've felt ready to move on earlier while still proving my suspicions. In projects since I've been more confident to move on sooner in my design exploration.
Despite the project's success, I still missed a few details in the tables-to-cards project. One example was that I didn't design the new cards to be keyboard accessible for sorting them. That interaction doesn't meet WCAG guidelines yet even though the rest of the work does, and it's on my list of UX debt for this project.
The pilot module of a full B2B redesign, and the research practice I founded to earn it. I owned the research and interaction design, then navigated a clinical UI that tested well and failed in the closed beta on data density.
Its framework carried into the later modules
View case study